Diagram Data and Pie Chart for NITech International Exchange
Global
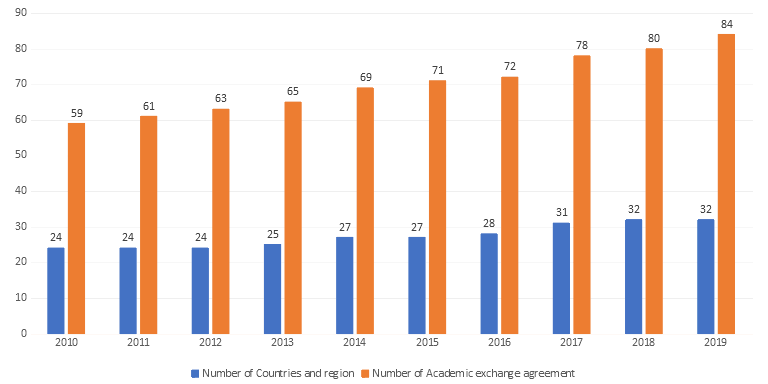
Changing Number of Academic Exchange Agreements
The number of our academic exchange agreements with partner universities and research institutions has been remarkably increased from 59 in 2010 to 84 in 2019. As one of the leading engineering universities in Japan, NITech encourages to extend more collaborations and exchanges with overseas universities and research institutions to provide opportunities to students, faculties and researchers.

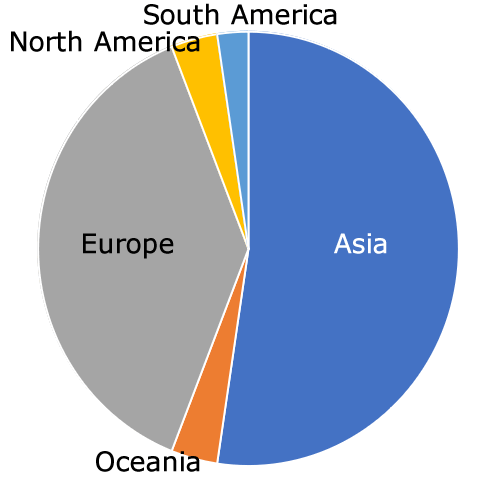
Pie Chart by Region of Academic Exchange Agreements as of May 1, 2019

As of May 1, 2019
| Asia | 44 |
|---|---|
| Oceania | 3 |
| Europe | 32 |
| North America | 3 |
| South America | 2 |
Number of academic exchange agreements.
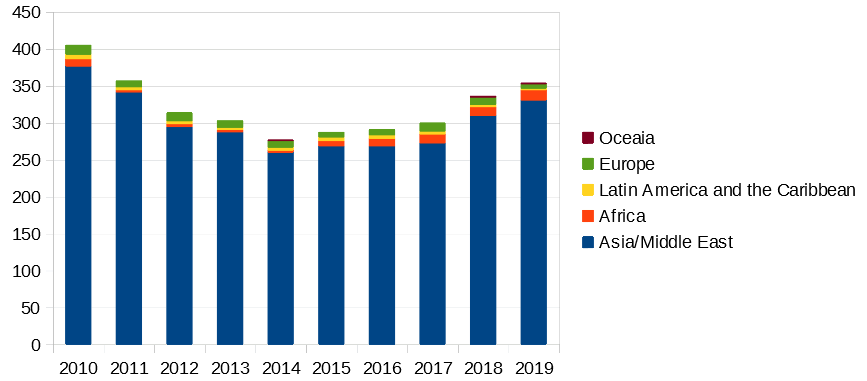
Transition of the Number of International Students
| Year | Asia / Middle East | Africa | Latin America and the Caribbean | Europe | Oceaia | Total |
|---|---|---|---|---|---|---|
| 2010 | 377 | 10 | 6 | 12 | 0 | 405 |
| 2011 | 342 | 3 | 4 | 8 | 0 | 357 |
| 2012 | 295 | 4 | 4 | 11 | 0 | 314 |
| 2013 | 288 | 3 | 3 | 9 | 0 | 303 |
| 2014 | 260 | 3 | 4 | 9 | 1 | 277 |
| 2015 | 269 | 7 | 5 | 6 | 0 | 287 |
| 2016 | 269 | 10 | 5 | 7 | 0 | 291 |
| 2017 | 273 | 12 | 4 | 11 | 0 | 300 |
| 2018 | 310 | 12 | 3 | 10 | 1 | 336 |
| 2019 | 331 | 14 | 2 | 6 | 1 | 354 |


 Japanese